Event System: Audit Trail for the Cluster
Written by:
Igor Gorovyy
DevOps Engineer Lead & Senior Solutions Architect
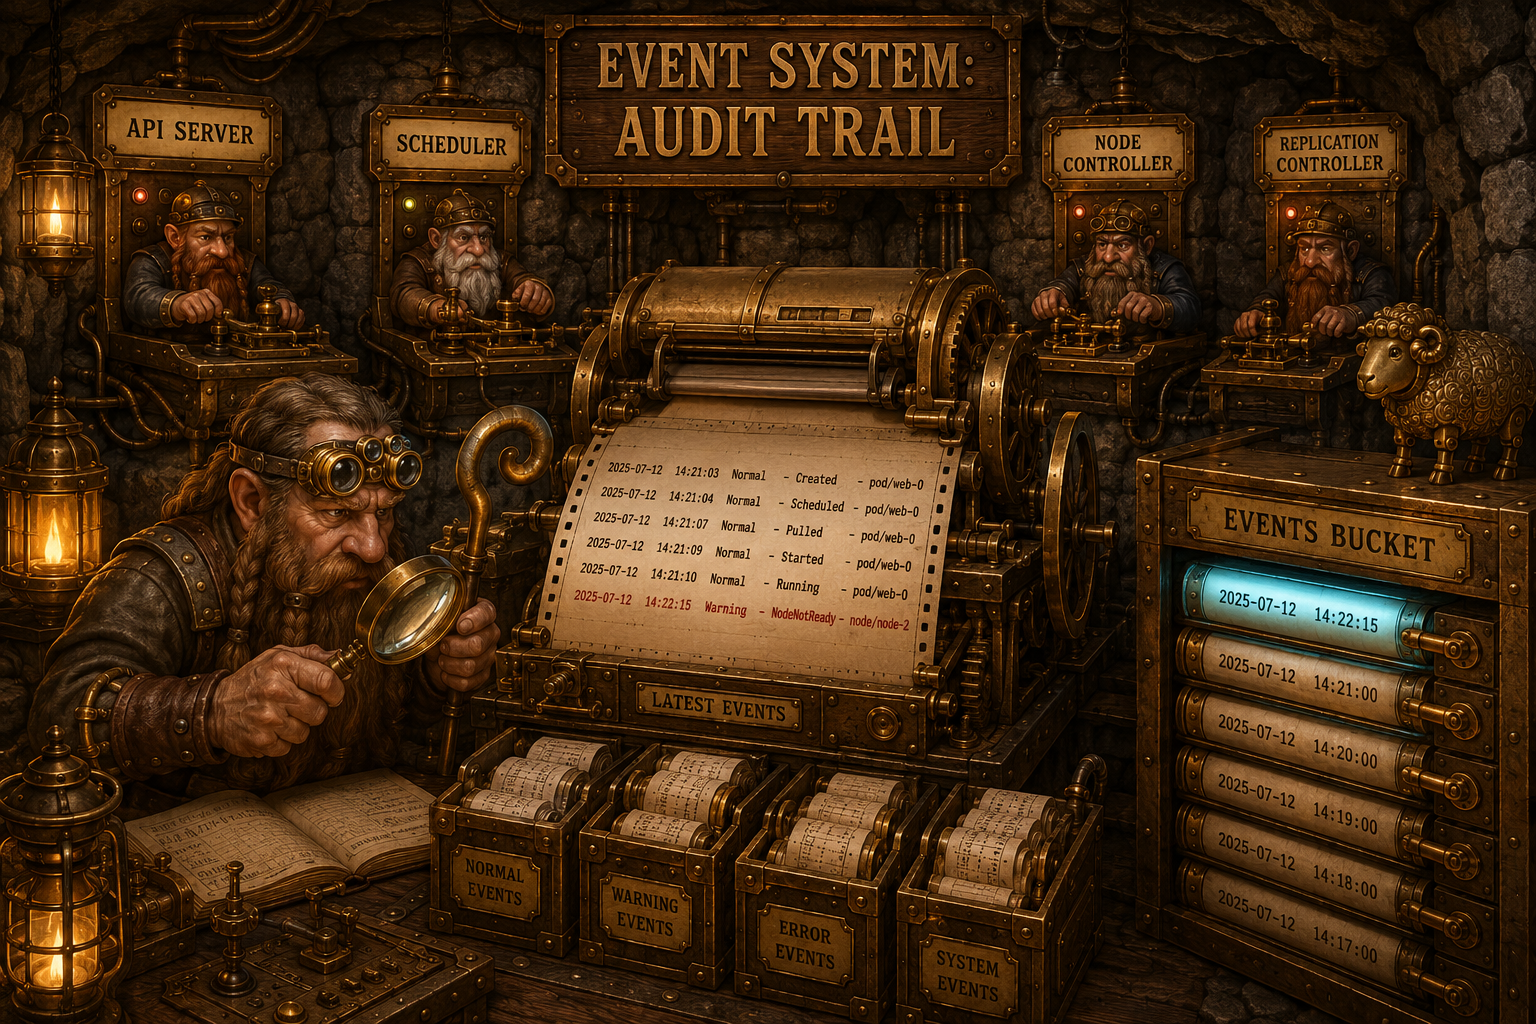
When something happens in the cluster, you need to know what, when, and why. Events are the event log that records everything: pod creation, scheduling, node failures.
Event Structure
type Event struct {
    Type      string    `json:"type"`      // Normal, Warning
    Reason    string    `json:"reason"`    // Created, Scheduled, NodeNotReady
    Message   string    `json:"message"`   // human-readable explanation
    Object    string    `json:"object"`    // pod/web-0, node/node-1
    Timestamp time.Time `json:"timestamp"`
}
Two types: Normal (all good) and Warning (problem). Object indicates which resource the event relates to.
Who Records Events
Different components record their own events:
// API Server - pod creation
api.store.RecordEvent(Event{
    Type: "Normal", Reason: "Created",
    Message: "Pod web-0 created",
    Object: "pod/web-0",
})

// Scheduler - scheduling
s.store.RecordEvent(Event{
    Type: "Normal", Reason: "Scheduled",
    Message: "Pod web-0 scheduled to node-1",
    Object: "pod/web-0",
})

// NodeController - node failure
nc.store.RecordEvent(Event{
    Type: "Warning", Reason: "NodeNotReady",
    Message: "Node node-1 heartbeat timeout",
    Object: "node/node-1",
})

// ReplicationController - scaling
rc.store.RecordEvent(Event{
    Type: "Normal", Reason: "Created",
    Message: "Created pod web-2 for deployment web",
    Object: "deployment/web",
})
Storage
func (s *Store) RecordEvent(evt Event) error {
    key := fmt.Sprintf("%d-%s",
        evt.Timestamp.UnixNano(), evt.Object)
    return s.put(bucketEvents, []byte(key), evt)
}
The key is a nanosecond timestamp plus the object. BoltDB stores keys sorted, so the latest events have the largest keys.
Reading (Newest First)
func (s *Store) ListEvents(limit int) ([]Event, error) {
    var events []Event
    s.db.View(func(tx *bolt.Tx) error {
        c := tx.Bucket(bucketEvents).Cursor()
        count := 0
        for k, v := c.Last(); k != nil && count < limit;
            k, v = c.Prev() {
            var evt Event
            json.Unmarshal(v, &evt)
            events = append(events, evt)
            count++
        }
        return nil
    })
    return events, nil
}
Cursor.Last() + Prev() - iterating from the end. We get the newest events first.
Viewing with sheepctl
$ sheepctl events
TYPE     REASON        OBJECT           MESSAGE
Normal   Created       pod/web-0        Pod web-0 created
Normal   Scheduled     pod/web-0        Pod web-0 scheduled to node-1
Normal   Created       pod/web-1        Created pod web-1 for deployment web
Warning  NodeNotReady  node/node-2      Node node-2 heartbeat timeout
This is like kubectl get events, just simpler.
💡 Fun facts
- Events in Kubernetes are a full-fledged API object with their own TTL: by default they live only about an hour, after which etcd deletes them. That's why
kubectl get eventsis often already empty after an incident - events aren't meant to be a long-term audit trail. - To keep identical events from flooding etcd, Kubernetes aggregates them: repeated events are collapsed into one with a
countand alastTimestampfield. Ourif condition != NodeNotReadycheck from earlier parts is a primitive, manual version of that same deduplication idea. - The real, genuine audit trail in Kubernetes is a separate mechanism - Audit Logging at the API Server level, not Events. It's a common misconception: Events are for humans and for debugging "what's happening right now," the audit log is for security and compliance.
- The sort-by-key trick isn't our invention. BoltDB (like LevelDB, RocksDB, etcd) keeps keys in a sorted B+tree, so a timestamp prefix gives free chronological ordering. Time-series databases are built on the same principle.
- In Kubernetes, every Event carries an
involvedObjectfield - a reference to the pod, node, or deployment it belongs to. That's whykubectl describe pod web-0automatically shows a timeline of events at the bottom: the UX is built around the object, not the component that wrote the log. - Kubernetes is migrating Events from
core/v1toevents.k8s.io/v1. The new API group adds structured fields and better aggregation - a sign that even "simple" observability objects evolve under production load. - The kube-apiserver runs a background garbage collector with
--event-ttl(default 1 hour). Our Shepherd store has no equivalent - events accumulate forever until you add rotation yourself. - Kubernetes Events are not Event Sourcing in the DDD sense. They are notifications about state changes, not the source of truth. The Deployment spec in etcd is the truth; the Event just says "something happened to it."
What I figured out while digging into this
The most surprising thing for me was that events aren't logs. I'm used to throwing everything into stdout, but a log is tied to the process that wrote it: the component crashes, the context disappears. An event, by contrast, is tied to an object (pod/web-0), not a process. So you can ask "what happened to this specific pod" and assemble the picture from different components - API, Scheduler, Agent - in one place. It's a different way of thinking: not "who logged what," but "what happened to the resource."
And one more thing: a nanosecond timestamp as part of the key looked like a hack at first. But that's exactly what gave both uniqueness and ordering in a single string. Sometimes the simplest solution is the right one.
What to watch out for
- The key is
timestamp + object. If two events for the same object land in the same nanosecond (unlikely, but possible), one overwrites the other. Real systems add a random suffix or UID to the key. - There's no TTL: our events grow in BoltDB forever. On a long-running production system the file bloats, and
Last()+Prev()has to page through more and more junk. - Recording an event is best-effort and not in the same transaction as the state change. You can update a node's status but crash before
RecordEvent- and the event is lost. An event is not a guarantee that the change happened.
What could be improved
- Add TTL/rotation: delete events older than N hours, or keep a fixed number of recent ones (ring buffer).
- Aggregate repeated events with a
countandlastTimestampinstead of recording each duplicate separately. - Add filtering at the API level (
?object=pod/web-0,?type=Warning) instead ofgrepon the client. - Stream events via
watch(SSE or long-poll), sosheepctl events -wshows them in real time rather than just a snapshot.
Try It Yourself
sheepctl events
# Filter by type:
sheepctl events | grep Warning
# Via API:
curl -s localhost:9876/api/v1/events | jq '.[0:5]'
The Orchestrator series is done. Up next - Image Registry: building your own Docker Registry from scratch.
Resources
- Event API reference: Kubernetes Event v1
- events.k8s.io API: structured Event objects with aggregation
- Audit logging: the real security audit trail, separate from Events
- kubectl: Viewing events: how operators typically read them
- Event sourcing: Martin Fowler's classic article (related idea, different purpose)
- BoltDB cursor: how
Last()+Prev()walks keys in reverse order
Source code for the series: github.com/igorgorovoy/sheep-shepherd-meadow
Previous: Pod Lifecycle | Next: OCI Distribution Spec