Pod Lifecycle: From Pending to Running
Written by:
Igor Gorovyy
DevOps Engineer Lead & Senior Solutions Architect
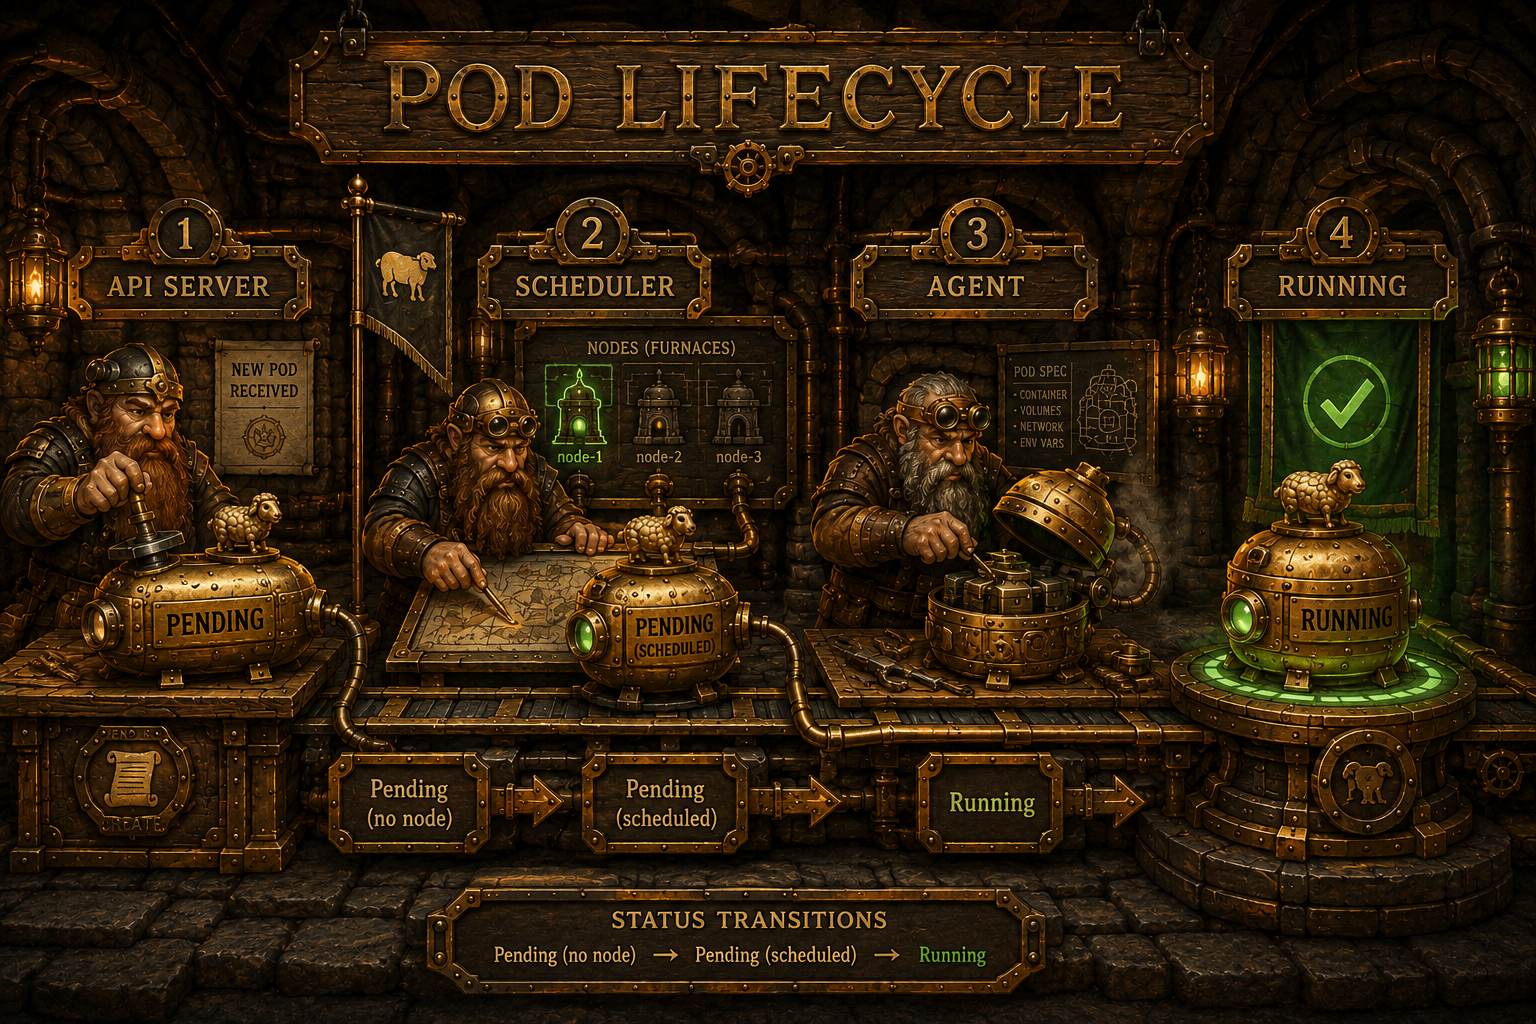
A pod passes through several components before it becomes Running. Each component works independently and asynchronously. Here's the full path.
sequenceDiagram
    participant U as sheepctl apply
    participant API as API Server
    participant Store as BoltDB
    participant Sched as Scheduler
    participant Agent as Agent (node-1)
    participant RT as Sheep Runtime

    U->>API: POST /api/v1/pods {name: web-0}
    API->>Store: Save pod (Phase: Pending, NodeName: "")
    API->>API: RecordEvent("Created")
    API-->>Sched: go SchedulePod()

    Note over Sched: Filter + Score nodes
    Sched->>Store: Update pod (NodeName: node-1)
    Sched->>Store: RecordEvent("Scheduled")

    Note over Agent: reconcile every 3s
    Agent->>API: GET /api/v1/pods
    Agent->>Agent: Pod web-0 Pending, my node
    Agent->>RT: Create container
    Agent->>RT: Start container
    RT-->>Agent: PID, Network IP
    Agent->>API: PUT pod (Phase: Running, IP: 10.20.0.2)
Pod Phases
stateDiagram-v2
    [*] --> Pending : API creates it
    Pending --> Pending : Scheduler assigns a node
    Pending --> Running : Agent starts containers
    Pending --> Failed : Agent couldn't start
    Running --> Failed : Container crashed
    Running --> Succeeded : Process exited with code 0
Pending without NodeName - waiting for the Scheduler. Possible reasons: no nodes available, not enough resources, nodeSelector doesn't match.
Pending with NodeName - waiting for the Agent. The Agent hasn't started the containers yet.
Running - all containers are working. The Agent checks them every 3 seconds.
Failed - one or more containers crashed. Depending on RestartPolicy, the controller may recreate the pod.
Eventual Consistency
No component waits for another. The API Server doesn't wait for the Scheduler to find a node. The Scheduler doesn't wait for the Agent to start the pod. Each one works at its own pace with reconciliation loops.
This means there's a delay. From sheepctl apply to Running can take 5-15 seconds:
- 0s: API Server creates the pod
- 0-2s: Scheduler finds a node (ticker 2s)
- 0-3s: Agent sees the pod (ticker 3s)
- 1-5s: Container starts
Health Check
When a pod is Running, the Agent keeps checking:
func (a *Agent) checkPod(pod *Pod) {
    for i, cs := range pod.Status.Containers {
        if cs.ContainerID == "" { continue }
        c, err := a.mgr.Get(cs.ContainerID)
        if err != nil {
            pod.Status.Containers[i].Ready = false
            continue
        }
        pod.Status.Containers[i].Ready =
            c.State == container.StateRunning
        pod.Status.Containers[i].State = string(c.State)
    }

    allRunning := true
    for _, cs := range pod.Status.Containers {
        if !cs.Ready { allRunning = false; break }
    }

    if !allRunning && pod.Status.Phase == PodRunning {
        pod.Status.Phase = PodFailed
        a.updatePodStatus(pod)
    }
}
If a container stops, the pod transitions to Failed.
What's Missing
There are no readiness/liveness probes. A pod becomes Running right after the container starts, even if the application inside is still loading. In Kubernetes, probes let you distinguish "process is running" from "application is ready to accept traffic."
💡 Fun facts
- The pod phase in Kubernetes is a deliberately coarse abstraction. The official docs explicitly warn: don't rely on
phasefor fine-grained logic, because it only aggregates container states. The real detail lives inconditions(PodScheduled,Ready,Initialized,ContainersReady). SucceededandFailedare terminal phases: a pod never goes back toRunningfrom them. That's why Jobs create a new pod on retry rather than "reviving" the old one. A pod in Kubernetes is essentially immutable after creation, save for a handful of fields.- The eventual consistency the whole pod path rests on is the same model as git: every component sees its own "version of the world" and converges with the rest over time. No global lock, no transaction across the whole cluster.
- What we call Pending is even finer in Kubernetes: between
PendingandRunningthere's a phase where the image is being pulled. There are separatePulling/Pulledevents - and this is exactly where pods most often "hang" in production due to a slow registry. - A pod also has
initContainersthat must run to completion before the main containers start. While they run, the pod is stillPending- so a pod can sit inPendingfor minutes not because scheduling failed, but because an init container is doing a slow migration or waiting on a dependency. - The "5-15 seconds" we measured is the same reason
kubectl applyreturns instantly while the pod is nowhere near ready.kubectlonly confirms the object was written to etcd. Everything after - schedule, pull, start - happens asynchronously, which is whykubectl wait --for=condition=Readyexists as a separate command. FailedandSucceededlook symmetric but a bare pod almost never reachesSucceededin practice: long-running services don't exit with code 0.Succeededis really the natural terminal state of Jobs and CronJobs, and it's why you can'tkubectl execinto a completed pod - there's no process left.- The RestartPolicy (
Always/OnFailure/Never) restarts containers inside the pod, not the pod itself. Each restart bumps a counter and applies exponential backoff, capped at 5 minutes - the infamousCrashLoopBackOffyou see inkubectl get podsis a container state, not a pod phase. terminationGracePeriodSeconds(default 30s) is the mirror image of startup: on delete, the kubelet sendsSIGTERM, waits, thenSIGKILL. A pod stuck inTerminatingusually means an app that ignoresSIGTERM- the eventual-consistency loop is patiently counting down before it forces the issue.
What I figured out while digging into this
The strongest click came when I stopped thinking about the lifecycle as a sequence of calls and started thinking about it as a set of independent observers of a shared state. Nobody "launches" anyone - each component looks at the pod, sees a gap between desired and actual, and takes one small step. Pending-without-NodeName and Pending-with-NodeName are the same Pending, but completely different components are waiting on it. Until I drew this out, the "5-15 second" latency looked like a bug. It turned out to be the sum of independent tickers - and it's predictable.
What to watch out for
Pendingis ambiguous: without a NodeName the Scheduler is the bottleneck; with one, the Agent is. Looking at the phase alone won't tell you who's actually "to blame" for the delay. Always check the NodeName too.- The
Running → Failedtransition is one-way here: a container crashes, the pod goes Failed and stays there. Without RestartPolicy=Always the pod won't come back on its own, and the ReplicationController only brings up a new one, not this one. - Latency is the sum of independent tickers (2s + 3s), so in the worst case it's about 5 seconds just to "notice," before the container even starts. Don't be alarmed that
applydoesn't give an instant Running.
What could be improved
- Add readiness/liveness probes so that
Runningmeans "ready to accept traffic," not just "the process started." - Introduce a
ContainerCreating/Pullingphase between Pending and Running, so you can see where exactly the pod is stuck (scheduling vs image pull vs start). - Implement RestartPolicy at the Agent level - restart the container within the same pod instead of immediately marking it Failed.
- Add pod
conditionsalongsidephase, to distinguish "scheduled," "image ready," "containers ready."
Try It Yourself
# Create a pod and watch events:
sheepctl apply -f examples/pod.json
watch -n1 sheepctl events
# You'll see: Created → Scheduled → Running
The pod lifecycle is clear. Next up - the Event System: a log of everything happening in the cluster.
Resources
- Pod lifecycle: phases, conditions, restart policy
- Pod termination: graceful shutdown details
- Pod conditions:
PodScheduled,Initialized,ContainersReady,Ready - Container probes: liveness, readiness, and startup probes
- Init containers: the sequential phase before the main containers
- Restart policy & CrashLoopBackOff: how container restarts back off
- State pattern: design pattern behind lifecycles
- Reconciliation / control loops: the eventual-consistency model the whole path rests on
Source code for the series: github.com/igorgorovoy/sheep-shepherd-meadow
Previous: Node Agent | Next: Event System