LangGraph traces with Arize Phoenix
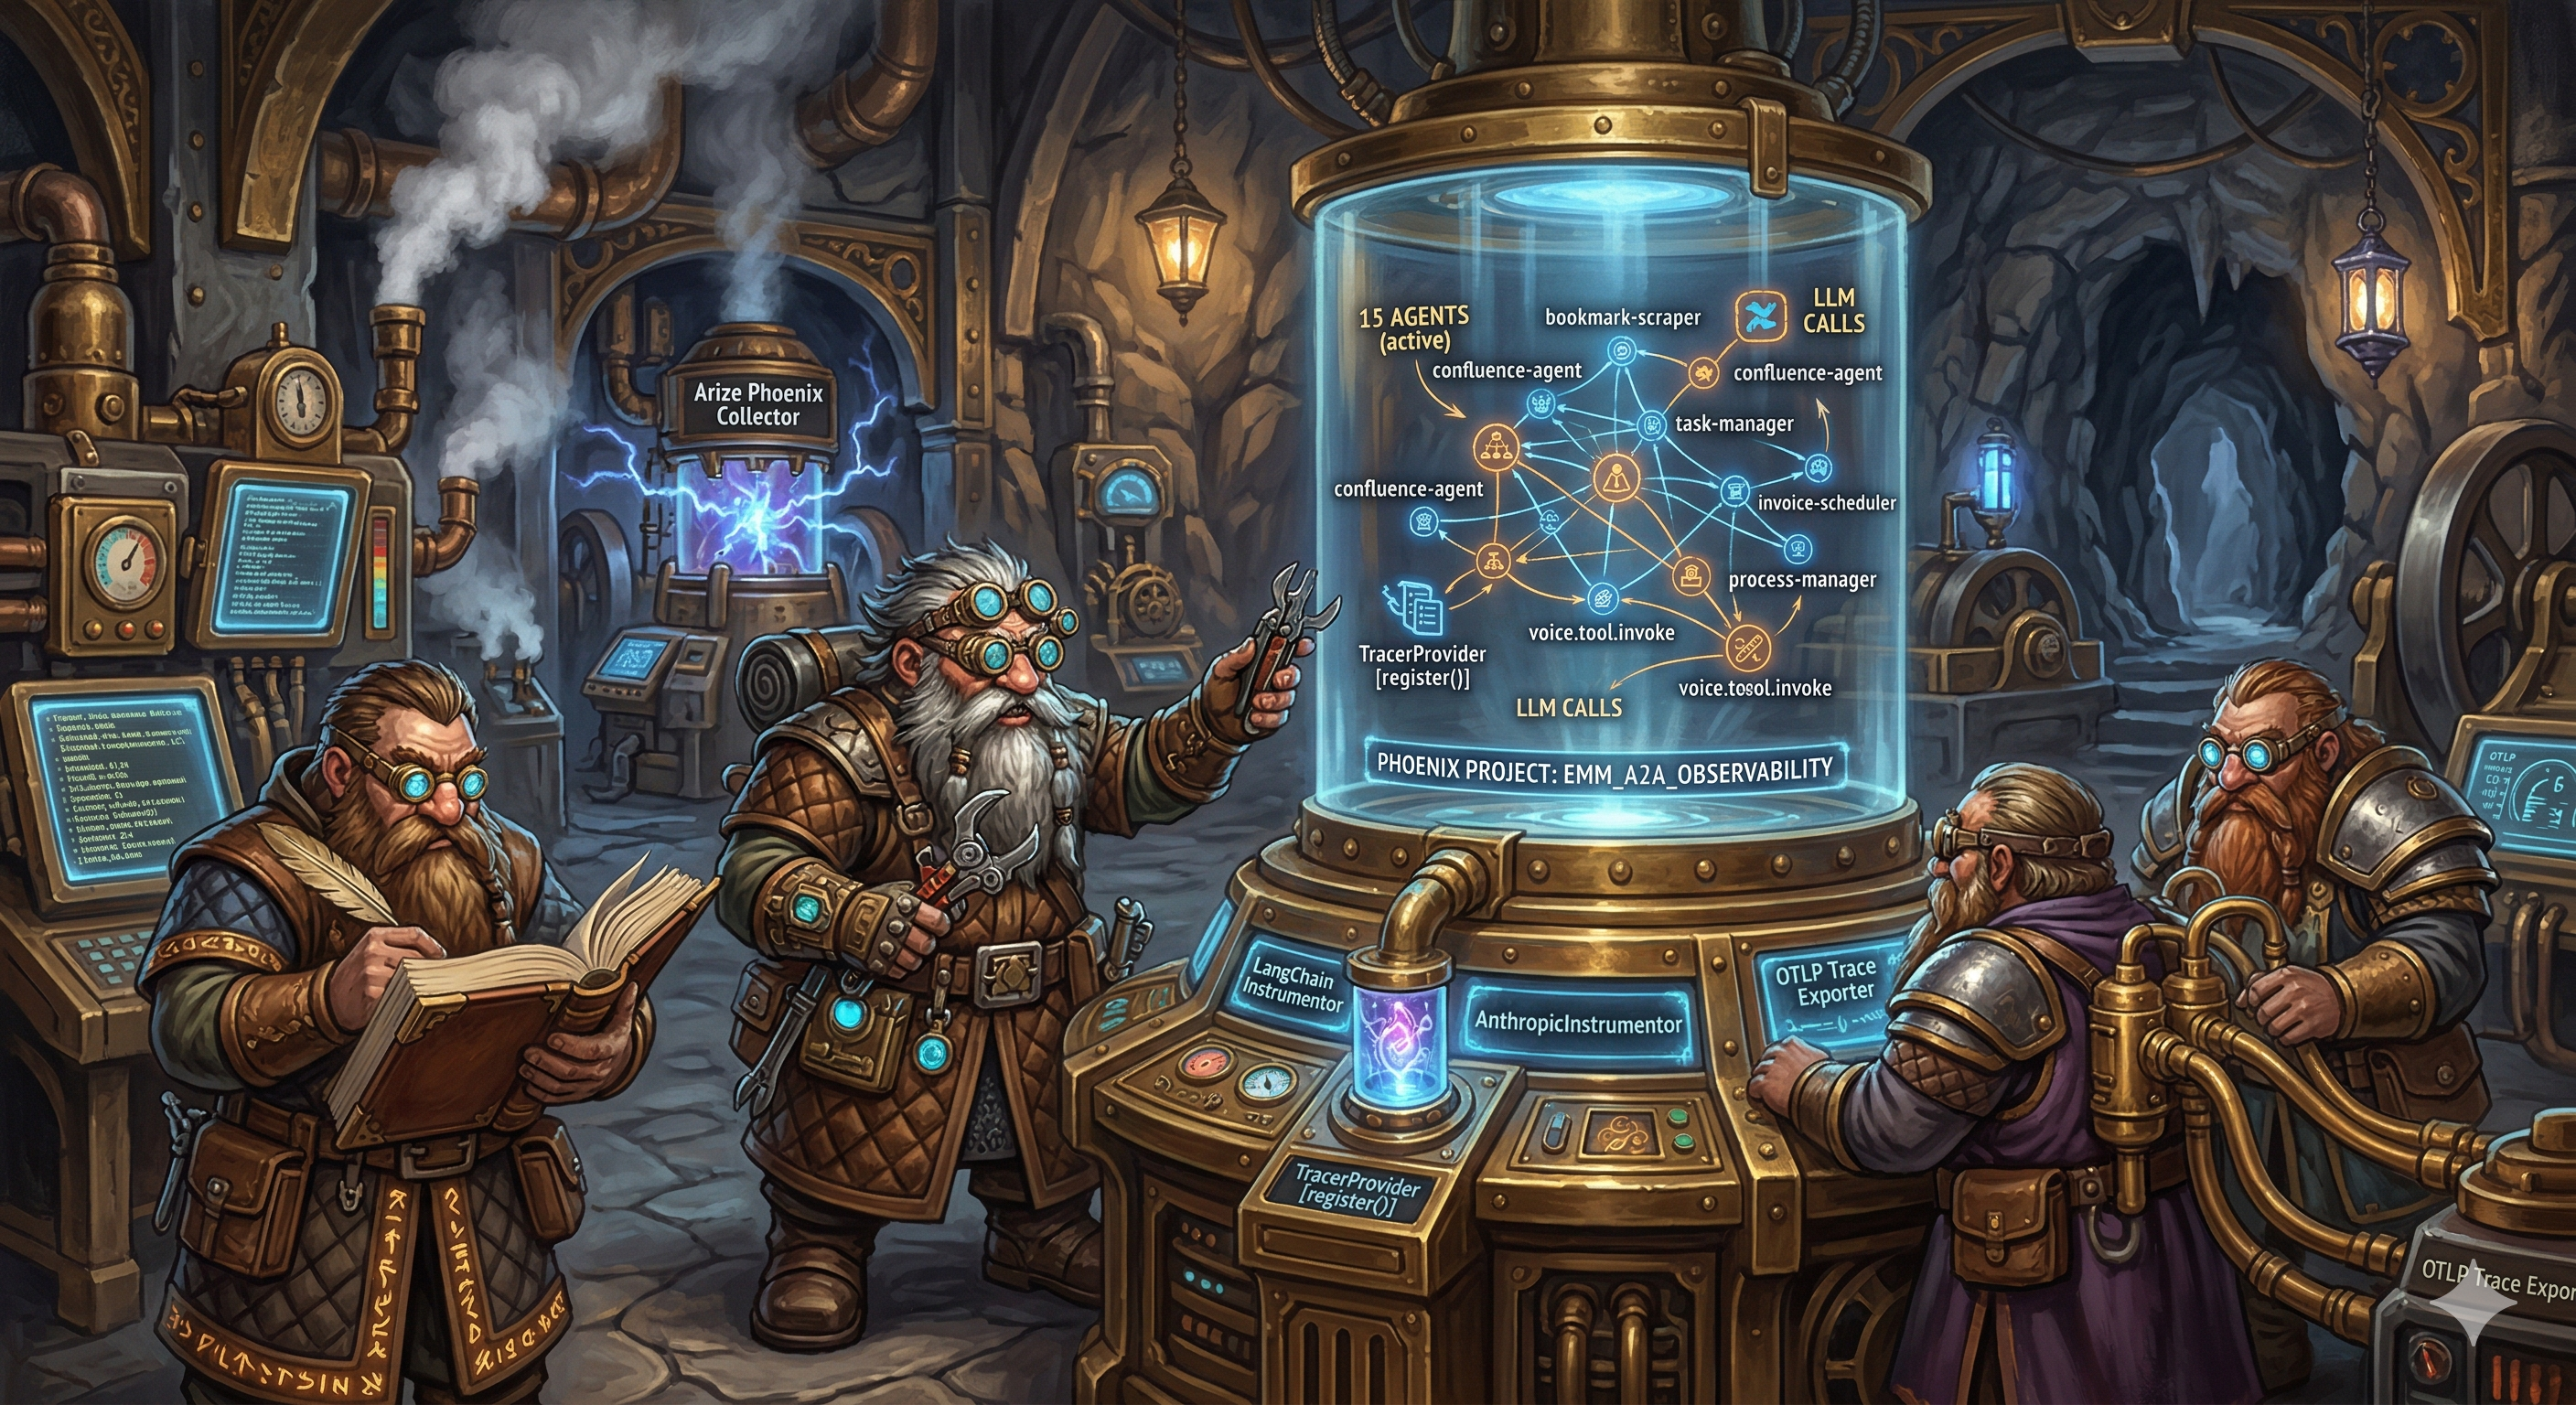
Expert Memory Machine currently has 15 LangGraph graphs in langgraph.json:
bookmark-classifierbookmark-scrapercontent-classifierconfluence-agentfile-system-agentjd-classifiernotifications-agentfinance-trackervector-store-agenttask-managercalendar-agentinvoice-agentinvoice-schedulersdlc-agentprocess-manager
When something “hangs” or the reply looks off, logs are often not enough: you see an error line, but not which graph node waited how long or what actually went to the model.
Here’s what I did: wired Arize Phoenix as a trace sink on top of OpenTelemetry. OpenInference for LangChain picks up LangGraph (ainvoke, invoke, astream_events) without editing every agent. I also enable AnthropicInstrumentor: the PM report button runs process-manager, which calls anthropic.messages.create directly, not via LangChain. LangChain-only patching never produced an LLM span for that path.
Here’s how it works
- Turn on
PHOENIX_ENABLED=true. - Point traces at the collector:
PHOENIX_COLLECTOR_ENDPOINT(defaulthttp://localhost:6006/v1/traces) andPHOENIX_PROJECT_NAMEfor grouping in the UI. - On backend startup before graphs load, call
init_phoenix_tracing(),phoenix.otel.register, thenLangChainInstrumentorandAnthropicInstrumentoron the sametracer_provider. - Any
graph.ainvoke(),graph.astream_events()from FastAPI orgraph.invoke()from the CLI is traced on the LangGraph path when Phoenix is reachable. Invoice generation in the API also usesgraph.invoke("invoice-agent")(two runs: invoice + optional results) instead of calling graph nodes by hand, so it follows the same tracing path as other agents.
Two diagrams below: how one init covers every agent in the process, and how graph-node spans nest with LLM calls in a single run.
All agents → one TracerProvider → Phoenix
Instrumentation runs once per process. The OpenInference patch lives in memory next to LangChain/LangGraph: it does not matter whether you call task-manager, calendar, or a classifier, every invoke / astream goes through the same hooks and sends spans to the same exporter.
flowchart TB
  subgraph boot ["Once per process startup"]
    init["init_phoenix_tracing()"]
    reg["register() → OTLP to PHOENIX_COLLECTOR_ENDPOINT"]
    lc["LangChainInstrumentor()"]
    ant["AnthropicInstrumentor()"]
    init --> reg --> lc --> ant
  end
  subgraph pool ["All LangGraph agents in this process"]
    g1["15 graphs from langgraph.json"]
  end
  subgraph per_run ["Each request, any graph"]
    inv["ainvoke / astream_events / invoke"]
    nodes["spans: graph nodes"]
    llm["spans: LLM via LangChain"]
    inv --> nodes --> llm
  end
  subgraph direct_sdk ["Direct Anthropic SDK e.g. PM report"]
    amsg["messages.create"]
  end
  lc -.->|"patch"| pool
  pool --> inv
  llm --> exp["spans → OTLP → Phoenix"]
  ant -.->|"patch"| amsg
  amsg --> exp
  reg -.-> exp
register sets a shared TracerProvider. For LangChain-based agents, LLM spans often nest under graph nodes. For anthropic.messages.create, spans come from AnthropicInstrumentor. Whether parent linkage into a single trace with weekly_report is perfect depends on OTEL context in your versions, but the model call shows up in the UI.
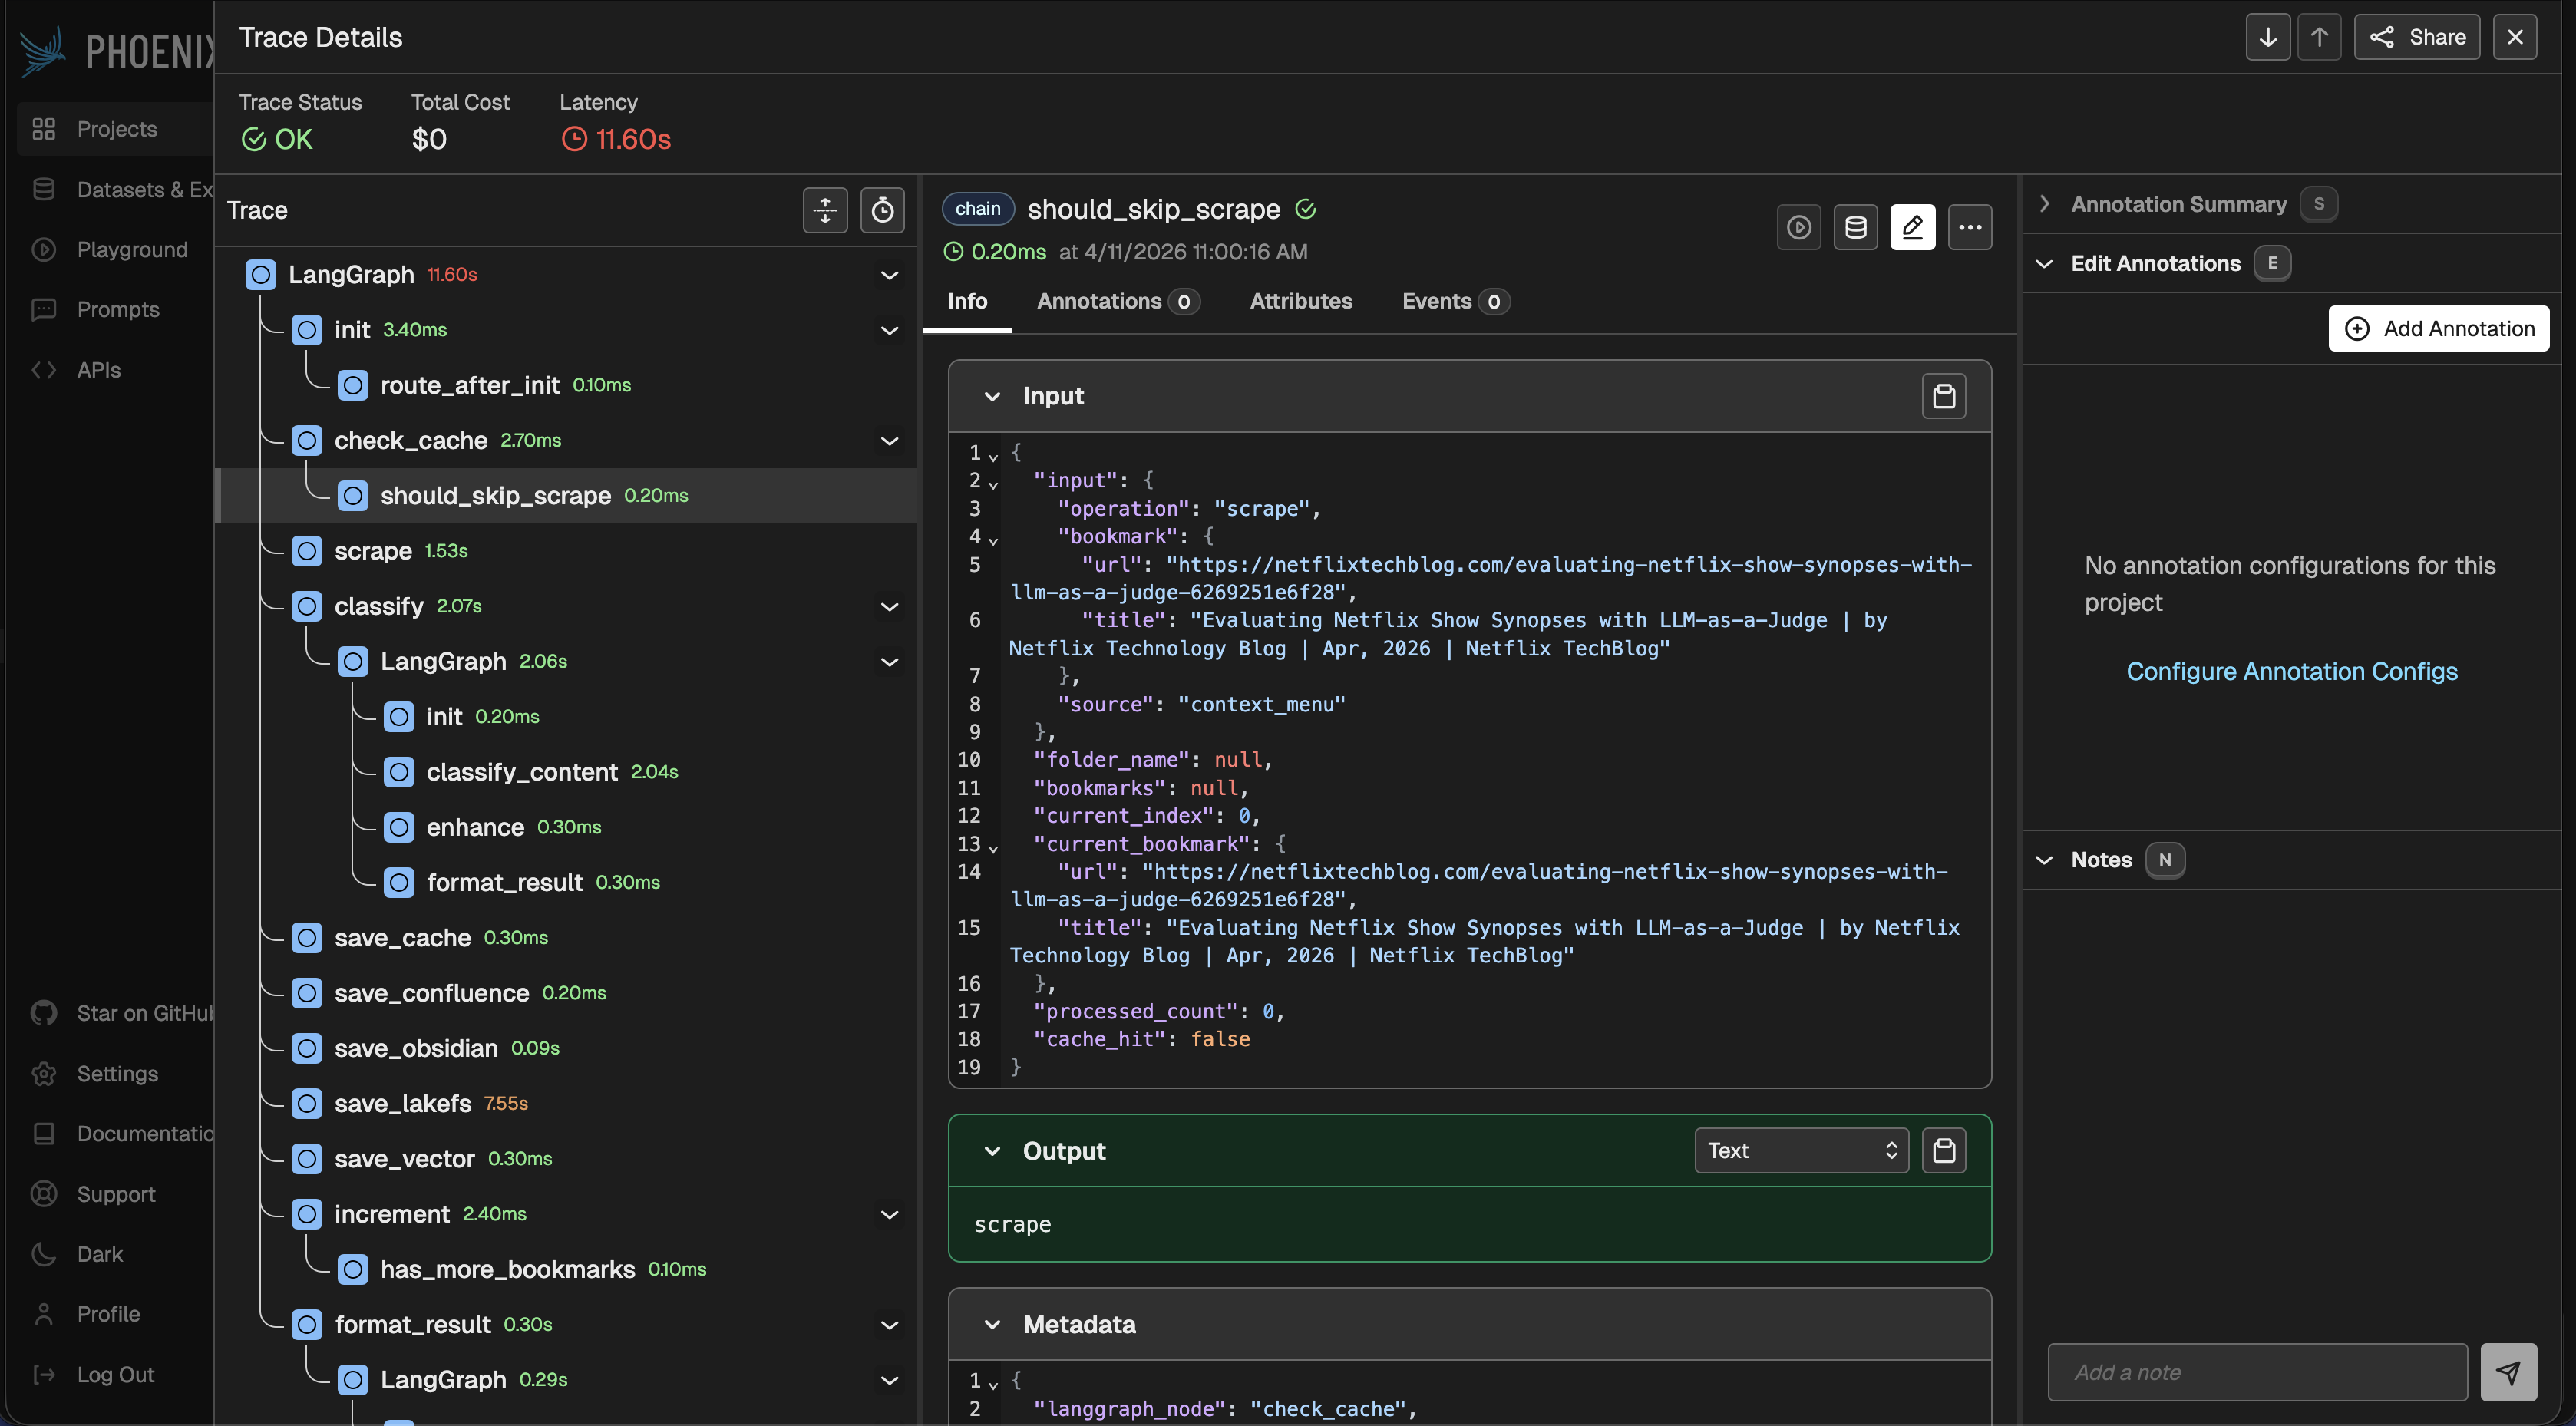
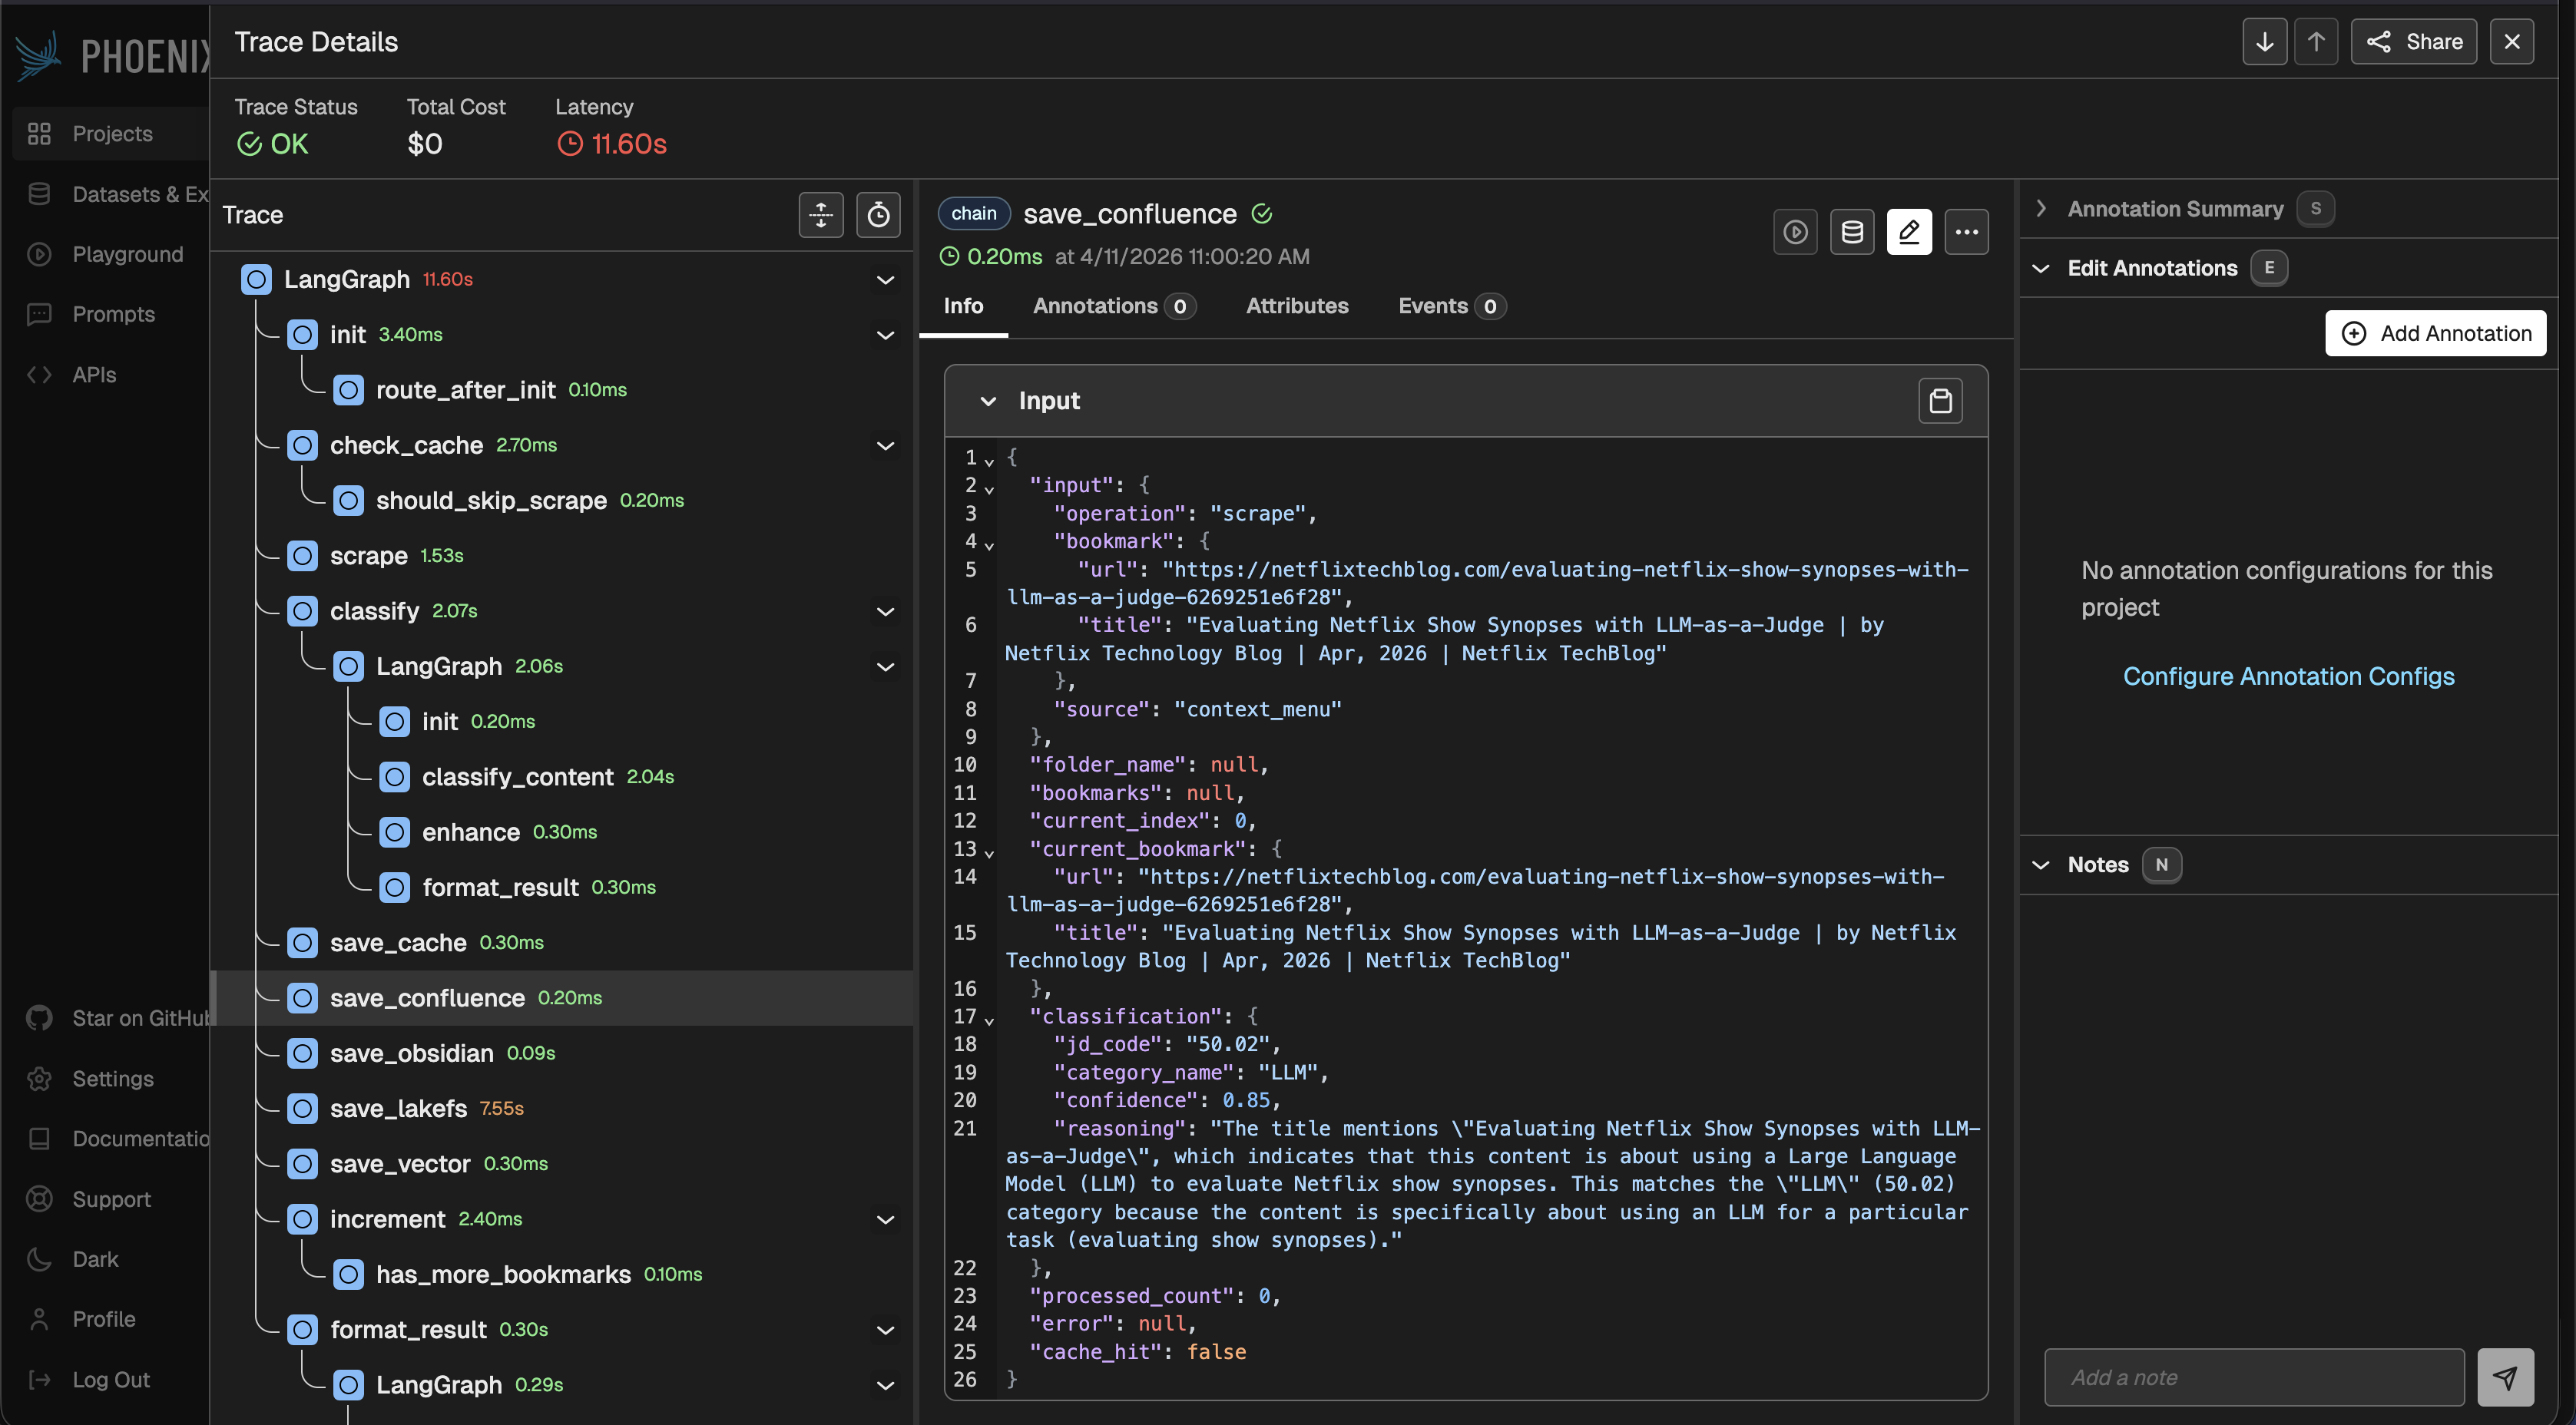
One run: graph, nodes, LLM
Typical UI: one trace per run, nested spans for the LangGraph chain and separate spans for model calls (exact shape depends on openinference / versions, but the idea holds).
sequenceDiagram
  autonumber
  participant App as FastAPI or CLI
  participant Graph as LangGraph
  participant Model as LLM client
  participant OTEL as OTEL SDK
  participant PX as Phoenix
  App->>Graph: ainvoke / astream_events
  Note over Graph,OTEL: root / chain span
  loop graph nodes
    Graph->>OTEL: node span
    alt node calls model
      Graph->>Model: chat / completion
      Model->>OTEL: child LLM span
    end
    alt node calls tool
      Graph->>OTEL: tool span
    end
  end
  OTEL-->>PX: OTLP traces
Phoenix UI
Init code lives in core/observability/phoenix_tracing.py in the EMM repo. Besides init_phoenix_tracing() for auto-instrumentation, the module also exposes get_tracer(name) and trace_span(tracer, name, attributes), lightweight helpers for manual spans in code that doesn't go through LangChain (voice tools, avatar sessions, direct HTTP chat calls):
def get_tracer(name: str) -> Tracer | None:
    """Return an OTel tracer, or None if Phoenix was not initialized."""
    if not _initialized:
        return None
    from opentelemetry import trace
    return trace.get_tracer(name)


@contextmanager
def trace_span(tracer, name, attributes=None):
    """Open a span if tracer is not None, else no-op."""
    if tracer is None:
        yield None
        return
    with tracer.start_as_current_span(name, attributes=attributes or {}) as span:
        yield span
When PHOENIX_ENABLED=false, get_tracer returns None, trace_span yields None without touching OTel (zero overhead). When Phoenix is on, spans go to the same collector as auto-instrumented ones.
If the LangChain package is missing or register / LangChainInstrumentor fails, init returns False. The Anthropic block is optional: missing package logs a warning but the app still starts (graph traces remain if LangChain succeeded).
I hooked entry points in two places:
- FastAPI: at the start of
lifespan, so no graph loads before instrumentation:
@asynccontextmanager
async def lifespan(app: FastAPI):
    from core.observability.phoenix_tracing import init_phoenix_tracing
    init_phoenix_tracing()
    # … rest of startup
- CLI
deploy/langgraph/run_agent.py, the same call before loading config and the graph.
Dependencies in requirements.txt: arize-phoenix[evals], arize-phoenix-otel, openinference-instrumentation-langchain, openinference-instrumentation-anthropic.
A concrete scenario
Locally: run Phoenix (python -m phoenix.server serve or a container from arizephoenix/phoenix), set PHOENIX_ENABLED=true in .env, install from updated requirements.txt, restart uvicorn on :8000. Sanity check: PM report on the task board (POST /api/process-manager/invoke), Phoenix should show both process-manager nodes and an Anthropic span. The Team Generate weekly report button (POST /api/team/generate-weekly-report) still has no LLM, template + cards only; don’t expect a model trace there.
In production or on a shared server it’s often easier to point PHOENIX_COLLECTOR_ENDPOINT at one shared instance than to run Phoenix in every docker-compose, otherwise versions and dashboards drift apart. But you need network access and secrets for the collector; if the endpoint is down, behavior depends on how the OTEL exporter handles failures, don’t assume it always fails quietly.
Beyond LangGraph: voice, avatar, chat
Auto-instrumentation covers anything that goes through LangChain. But EMM also has three components that bypass LangChain entirely:
- Voice: Gemini Live runs on the frontend via WebRTC; the backend only executes tool calls (calendar, tasks, KB, web search) and creates tokens.
- Avatar: Runway.ml real-time lip-sync sessions: create, poll for READY, consume WebRTC credentials.
- Izabella text chat: direct HTTP to OpenAI, Ollama, or Google; plus an MCP tool loop with multi-round function calling.
None of these produce spans from LangChainInstrumentor or AnthropicInstrumentor. The Anthropic SDK calls inside Izabella chat are auto-traced, but OpenAI/Ollama/Google are just httpx.post, invisible.
The fix: manual spans using get_tracer / trace_span from the same module. Each component gets a named tracer (emm.voice.tools, emm.avatar, emm.izabella.chat.llm, emm.izabella.chat.mcp) and wraps key operations in spans with useful attributes.
What’s instrumented now
| Component | Span name | Key attributes |
|---|---|---|
| Voice token | voice.token.create |
voice.token_type, voice.model |
| Voice tool call | voice.tool.invoke |
voice.tool.name, voice.tool.mcp_alias |
| Avatar session | avatar.session.create |
avatar.type, avatar.preset, avatar.session_id, avatar.poll_count |
| Chat LLM (Ollama) | chat.llm.ollama |
llm.provider, llm.model |
| Chat LLM (OpenAI) | chat.llm.openai |
llm.provider, llm.model |
| Chat LLM (Google) | chat.llm.google |
llm.provider, llm.model |
| Chat MCP loop | chat.mcp_loop.* |
llm.provider, llm.model, chat.mcp_rounds_total |
| Chat MCP tool | chat.mcp.tool |
mcp.alias, mcp.tool_name |
Example: when a user sends a message in Izabella chat with LLM_PROVIDER=openai and MCP tools active, Phoenix shows a parent chat.mcp_loop.openai span containing child chat.llm.openai spans (one per round) and chat.mcp.tool spans for each function call, nested the same way LangGraph nodes nest under a chain span.
Typical trace: Izabella chat with MCP tools
sequenceDiagram
  autonumber
  participant UI as Frontend
  participant API as FastAPI
  participant LLM as OpenAI / Ollama / Google
  participant MCP as MCP tool server
  participant OTEL as OTEL SDK
  participant PX as Phoenix

  UI->>API: POST /izabella-chat/sessions/{id}/messages
  Note over API,OTEL: chat.mcp_loop.openai span
  loop tool rounds
    API->>LLM: chat completion
    Note over LLM,OTEL: chat.llm.openai span
    LLM-->>API: tool_calls
    loop per tool call
      API->>MCP: invoke tool
      Note over MCP,OTEL: chat.mcp.tool span
      MCP-->>API: result
    end
  end
  API->>LLM: final completion
  LLM-->>API: text reply
  OTEL-->>PX: OTLP traces
Typical trace: voice tool invocation
sequenceDiagram
  autonumber
  participant FE as Frontend (Gemini Live)
  participant API as FastAPI
  participant Store as calendar / task / KB store
  participant OTEL as OTEL SDK
  participant PX as Phoenix

  FE->>API: POST /voice/tools/invoke {name, arguments}
  Note over API,OTEL: voice.tool.invoke span
  API->>Store: handler(arguments)
  Store-->>API: result
  API-->>FE: {result}
  OTEL-->>PX: OTLP traces
Coverage summary
| Component | LLM traces | Tool / API traces |
|---|---|---|
| 15 LangGraph agents | Auto (LangChainInstrumentor) | Auto (LangChainInstrumentor) |
| Direct Anthropic SDK | Auto (AnthropicInstrumentor) | -- |
| Voice (Gemini Live) | N/A (frontend) | Manual spans |
| Avatar (Runway.ml) | N/A | Manual spans (session lifecycle) |
| Chat (Anthropic) | Auto + loop span | Manual spans (MCP tools) |
| Chat (OpenAI) | Manual spans | Manual spans (MCP tools) |
| Chat (Ollama) | Manual spans | Manual spans (MCP tools) |
| Chat (Google) | Manual spans | N/A (no MCP tool loop) |
Limitations
- Overhead. Every span costs CPU and memory. Under very high traffic it makes sense to leave Phoenix off (
PHOENIX_ENABLED=false) and enable it only for debugging. Manual spans add negligible cost when the tracer isNone. - Auto-instrumentation is a black box. Keep LangChain/LangGraph and openinference versions aligned.
- Manual spans are shallower than auto-instrumented ones.
LangChainInstrumentorcaptures token counts, prompt/completion text, model parameters. Manual spans only carry the attributes we explicitly set, provider, model, tool name. If you need token-level detail for OpenAI/Ollama chat, you’d need to parse it from the response and add it to the span. - Voice LLM runs on the frontend. Gemini Live audio streaming happens over WebRTC in the browser, there’s no backend LLM call to trace. We can only observe the tool invocations that come back to the server.
- Not a replacement for logs and alerts. Phoenix shows an execution trace, not business metrics or SLOs. LangSmith in the project stays its own world if you already use it. Phoenix doesn’t “replace” LangSmith by itself; it’s another channel if you turn it on.
What’s next
Document in SETUP how to enable Phoenix. Consider adding OpenInference instrumentors for OpenAI (openinference-instrumentation-openai) if richer LLM spans are needed for Izabella chat; that would give token counts and prompt content without manual parsing. Phoenix here is only a tool for dissecting a specific run, not the single source of truth for system health.